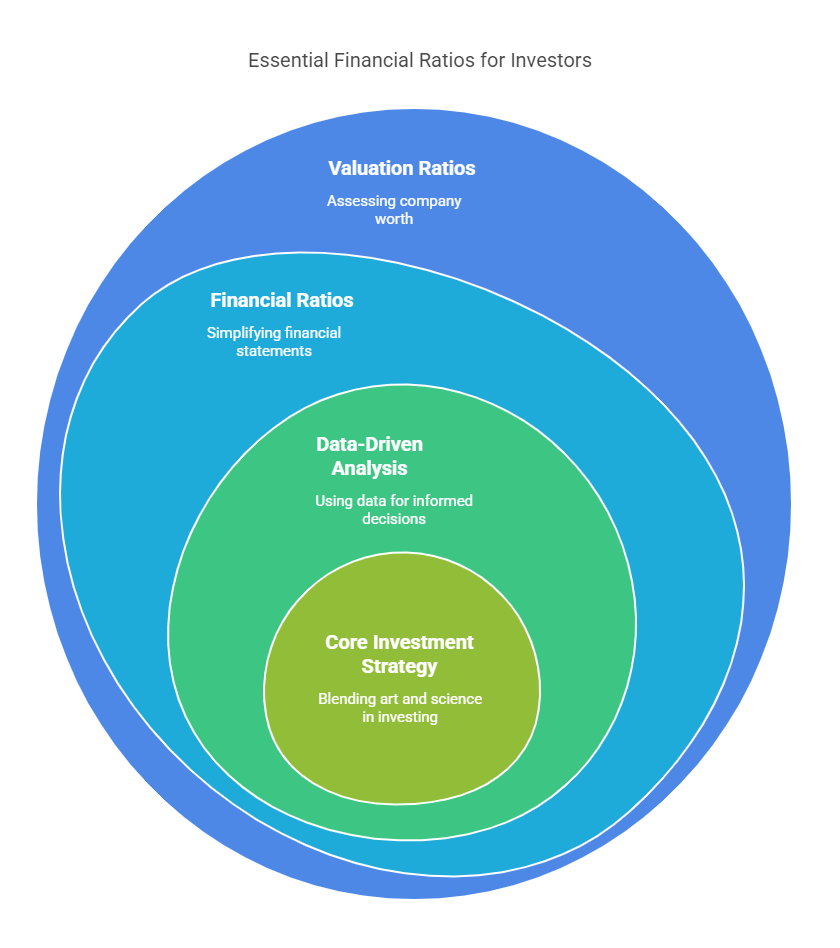
Investing in the stock market requires a blend of art and science. While intuition and market trends play a role, data-driven analysis is crucial for informed decisions. To begin with, financial ratios distill complex financial statements into digestible metrics, offering insights into valuation, profitability, liquidity, and more. Here’s a curated list of the 15 best ratios every investor should know, categorized to help you navigate the financial landscape with confidence.
### Valuation Ratios
Determine if a stock is overvalued or undervalued relative to its fundamentals.
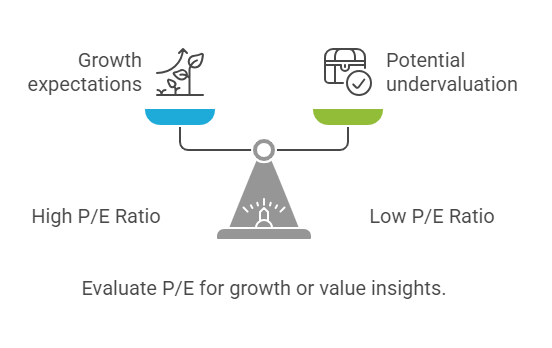
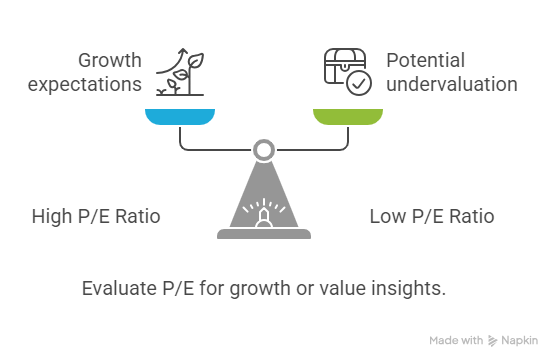
1. Price-to-Earnings (P/E) Ratio
–Formula: Market Price per Share ÷ Book Value per Share
Insight: The P/E ratio compares a company’s current share price to its earnings per share (EPS). A P/E around 15 to 20 is often considered a benchmark for a fairly valued stock. A high P/E (above 20) typically signals investor expectations of strong future growth, while a low P/E (below 15) may indicate the stock is undervalued or that the market has concerns about the company’s future earnings potential. Interpreting P/E requires considering the company’s growth prospects and the industry it operates in.
Watch Out: Keep in mind that intangible assets (e.g., patents) may not reflect in book value.
– Watch Out: Trailing vs. forward P/E; cyclical companies may skew ratios temporarily
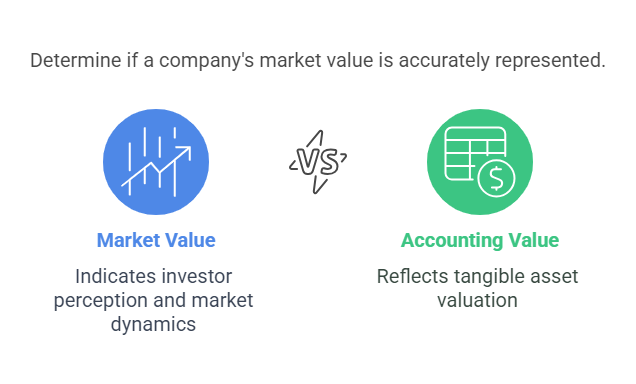
2. Price-to-Book (P/B) Ratio
– Formula: Market Price per Share ÷ Book Value per Share
Insight: Compares market value to accounting value. Typically, a P/B <1 suggests undervaluation, making it ideal for asset-heavy sectors like banking.
Watch Out: Keep in mind that intangible assets (e.g., patents) may not reflect in book value.
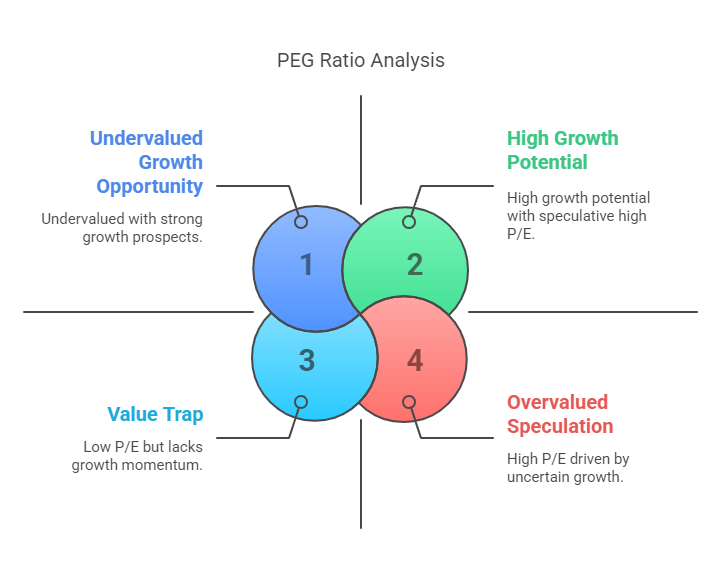
3. PEG Ratio
– Formula: P/E Ratio ÷ Annual EPS Growth Rate
– Insight: Adjusts P/E for growth. A PEG < 1 implies undervaluation. Useful for high-growth companies.
– Watch Out: Relies on accurate growth projections, which can be speculative.
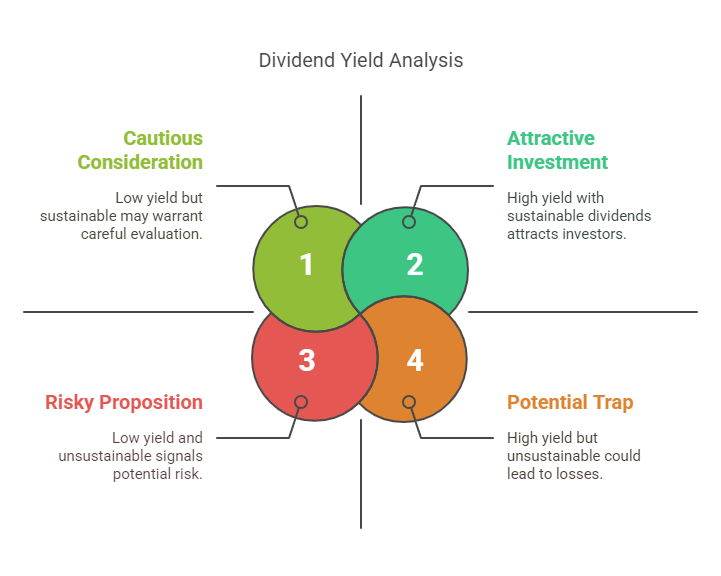
4. Dividend Yield
– Formula: Annual Dividends per Share ÷ Stock Price
– Insight: Highlights income-generating potential. A high yield attracts income investors, but assess payout sustainability.
– Watch Out: Unsustainably high yields may signal impending dividend cuts.
—
### Profitability Ratios
Assess a company’s ability to generate profits.
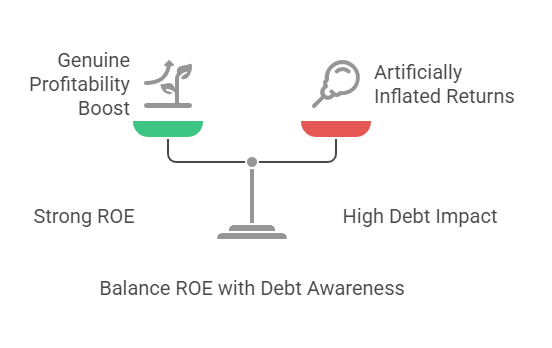
5. Return on Equity (ROE)
– Formula: Net Income ÷ Shareholders’ Equity
– Insight: Reveals profit generated from equity. ROE > 15% is strong, but check for excessive debt inflating returns.
– Watch Out: High debt can artificially boost ROE.
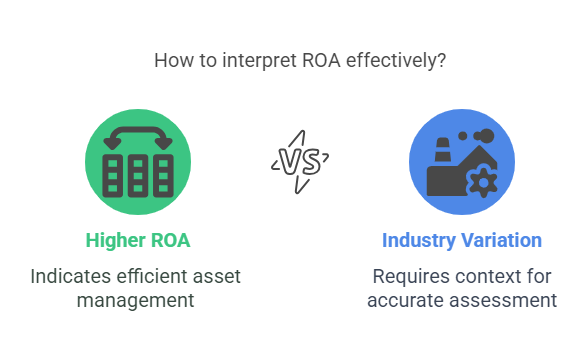
6. Return on Assets (ROA)
– Formula: Net Income ÷ Total Assets
– Insight: Gauges efficiency in asset utilization. Higher ROA indicates better management.
– Watch Out: Varies by industry; capital-intensive firms typically have lower ROA.
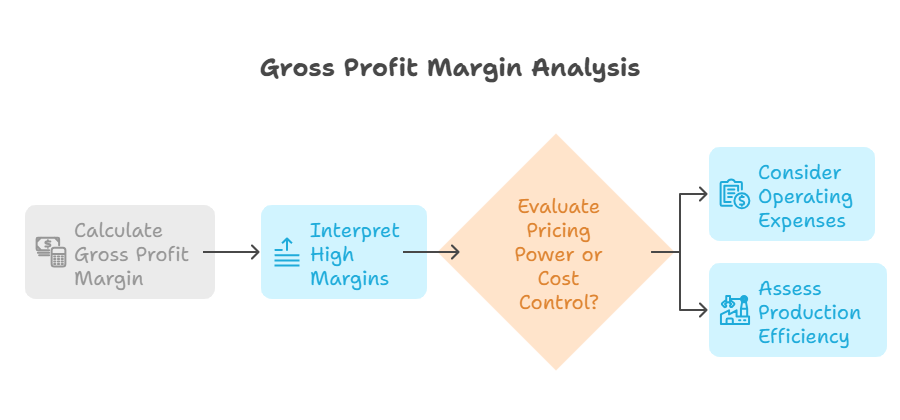
7. Gross Profit Margin
– Formula: (Revenue – COGS) ÷ Revenue
– Insight: Reflects core profitability after production costs. High margins suggest pricing power or cost control.
– Watch Out: Doesn’t account for operating expenses like R&D.
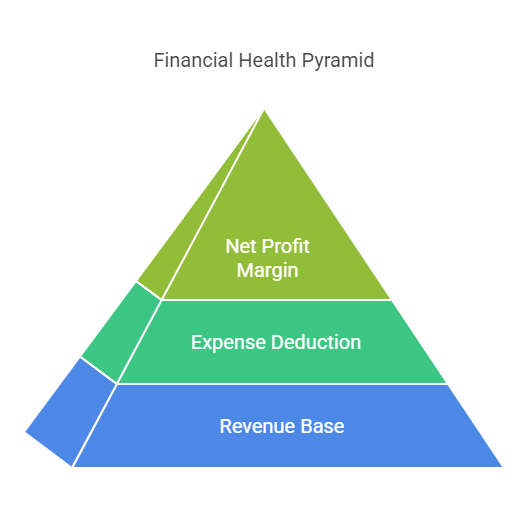
8. Net Profit Margin
– Formula: Net Income ÷ Revenue
– Insight: The bottom-line margin after all expenses. Consistently high margins indicate strong overall management.
– Watch Out: Non-recurring items (e.g., asset sales) can distort results.
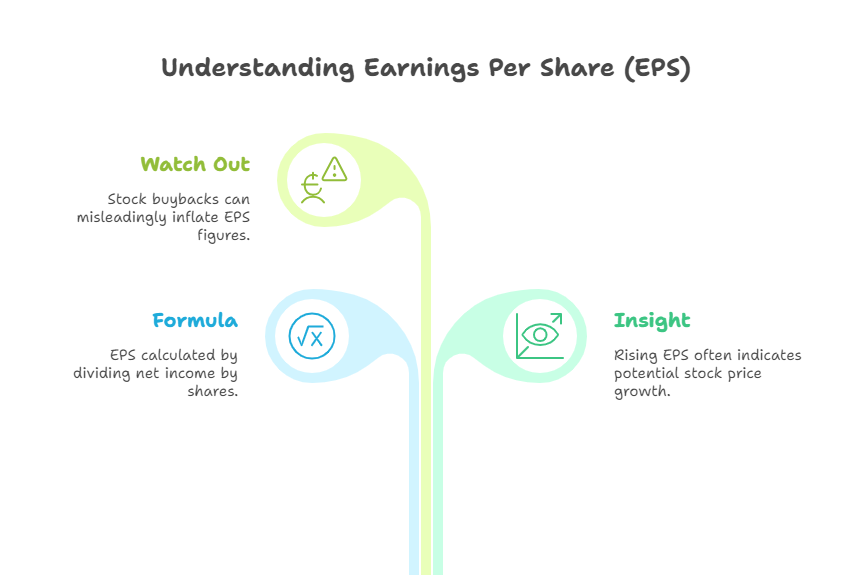
9. Earnings Per Share (EPS)
– Formula: Net Income ÷ Outstanding Shares
– Insight: Shows profitability per share. Rising EPS often correlates with stock price growth.
– Watch Out: Stock buybacks can inflate EPS without real profit growth.
—
### Liquidity Ratios
Evaluate ability to meet short-term obligations.
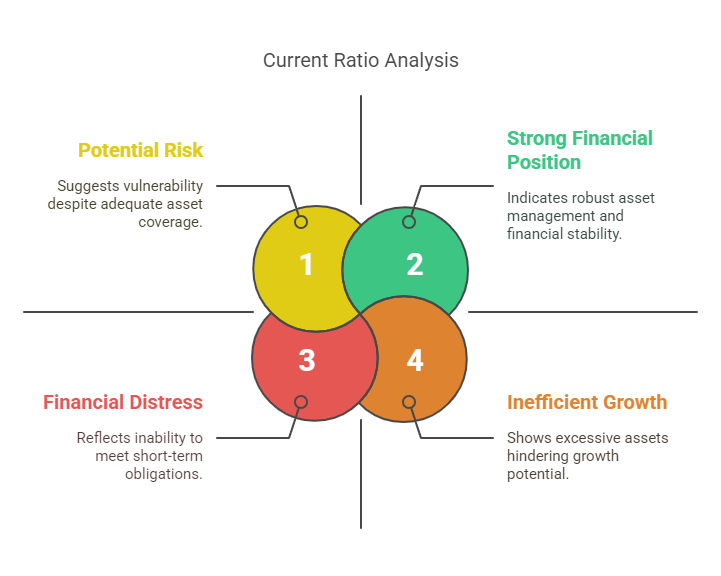
10. Current Ratio
– Formula: Current Assets ÷ Current Liabilities
– Insight: A ratio > 1 means assets cover liabilities. Critical for assessing financial health during downturns.
– Watch Out: High ratios may indicate inefficient asset use.
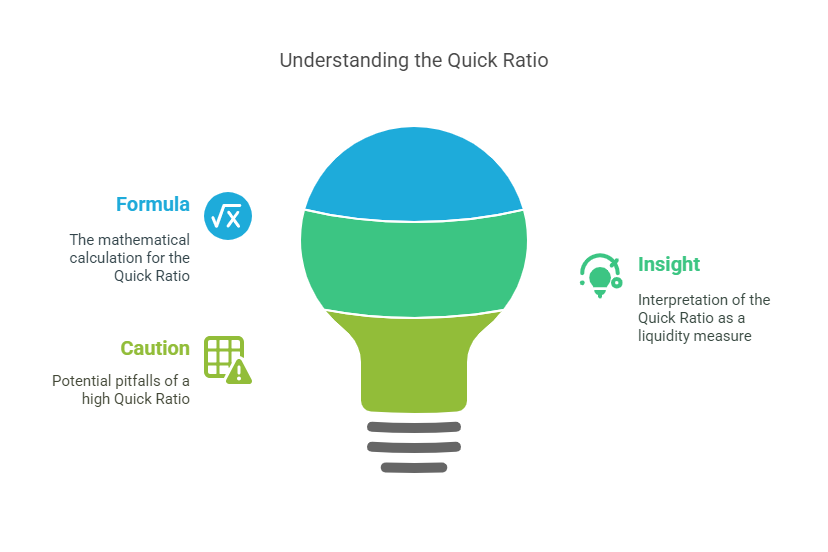
11. Quick Ratio (Acid-Test)
– Formula: (Current Assets – Inventory) ÷ Current Liabilities
– Insight: A stricter liquidity measure, excluding less liquid inventory. Ideal for industries with slow-moving stock.
– Watch Out: Too high may signal excess idle cash.
—
### Leverage Ratios
Measure debt levels and repayment capacity.
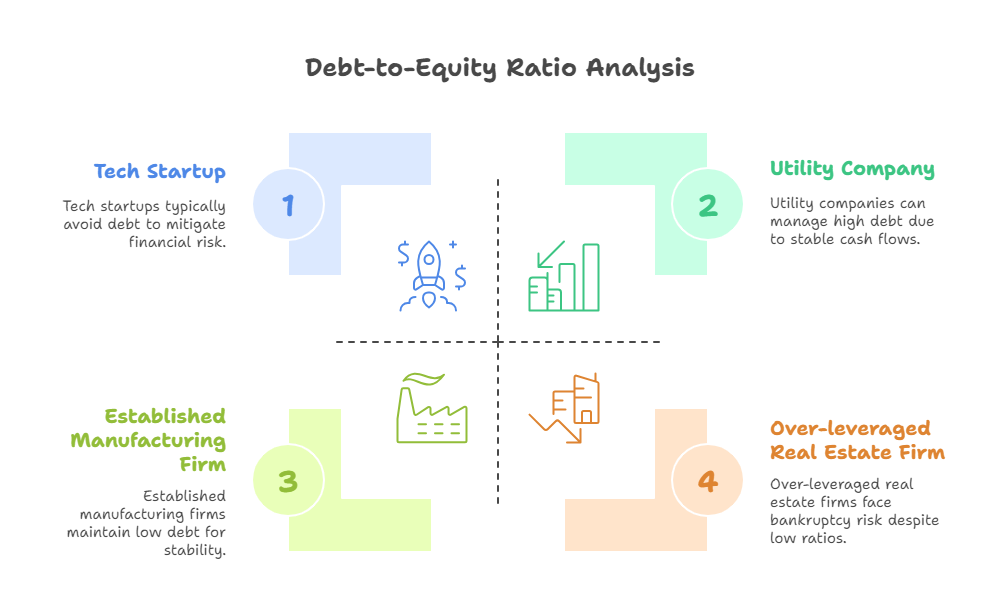
12. Debt-to-Equity Ratio
– Formula: Total Liabilities ÷ Shareholders’ Equity
– Insight: High ratios (>2) indicate heavy debt reliance, increasing bankruptcy risk. Varies by sector (e.g., utilities tolerate higher debt).
– Watch Out: Off-balance-sheet liabilities can understate true debt.
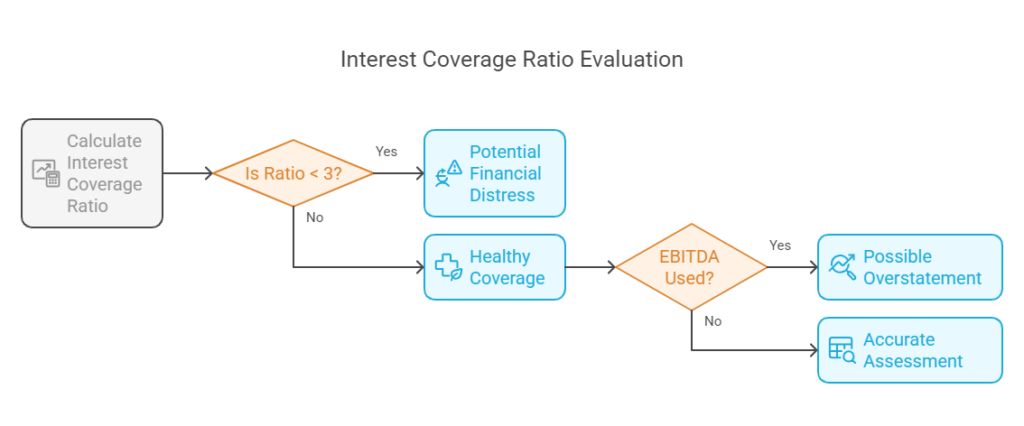
13. Interest Coverage Ratio
– Formula: EBIT ÷ Interest Expense
– Insight: Tests ability to service debt. A ratio <3 may signal distress.
– Watch Out: EBITDA-based versions exclude depreciation, potentially overstating coverage.
—
### Efficiency Ratios
Gauge operational effectiveness.
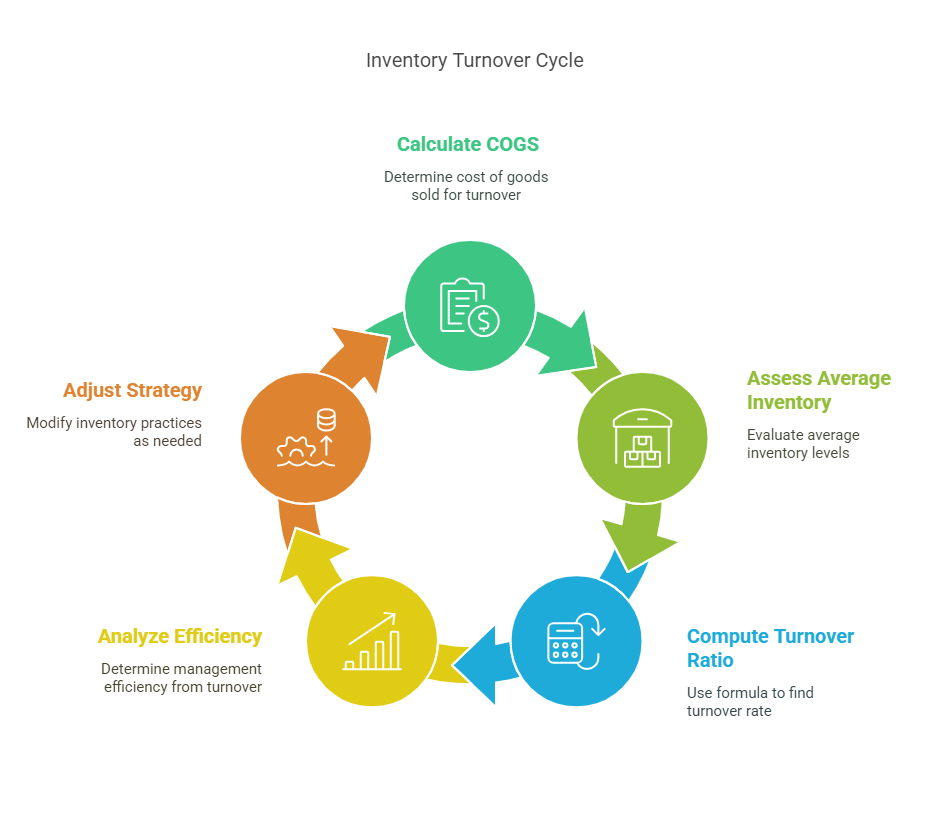
14. Inventory Turnover
– Formula: COGS ÷ Average Inventory
– Insight: High turnover indicates efficient inventory management. Low turnover may signal obsolescence.
– Watch Out: Excessively high turnover risks stockouts.
15. Asset Turnover
– Formula: Revenue ÷ Total Assets
– Insight: Measures revenue per dollar of assets. Higher ratios reflect better asset utilization.
– Watch Out: Industry-specific; retail typically has higher turnover than manufacturing.
—
### Conclusion
Financial ratios are powerful tools, but they’re not standalone solutions. Context is key—compare ratios to industry peers and historical trends. Combine quantitative analysis with qualitative factors like management quality and competitive advantages. Remember, a low P/E or high ROE alone doesn’t guarantee success. Use these 15 ratios as a foundation, but always dig deeper to build a resilient investment strategy. Happy investing!